You’ve probably heard by now that there’s been a big shakeup in the digital world with Google discontinuing one of its flagship products, Universal Analytics (referred to as GA3 or UA), which will no longer be tracking any data from July 1st 2023.
The good news is that Google has released Google Analytics 4 (or GA4), which will collect most (or perhaps all) of the same data you’re used to seeing, and it’s available to use right now.
GA4 is an entirely new tool that uses different data models, so it stands to reason that the reports GA4 provides will also be different.
So, the big question on everyone’s lips is…
What are the main differences between Google Analytics 4 and Universal Analytics?
Without going into the finer details of everything different between the two platforms, we’ll focus on what we feel will be of most benefit to you, the end user.
Here are some new words and their meanings
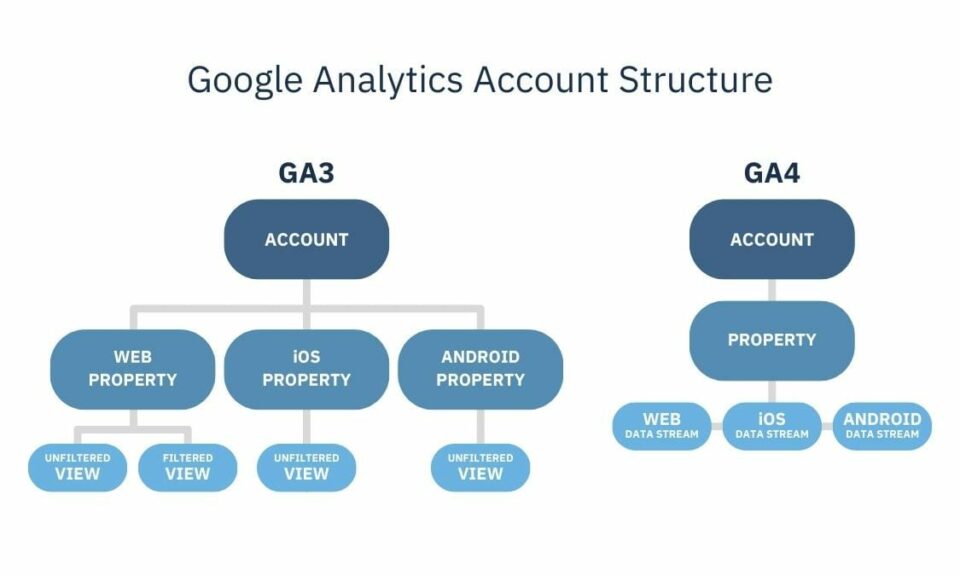
No more Views (GA3), now we have Data Streams (GA4)
In GA3, you had your account, under which sat a property (like a website, blog or app), and under each property, you had views. By default, you had one unfiltered view within which you could see all of your analytics reports. You could then set up additional views if you wanted to by defining filters.
Example 1: You could have a view for tracking traffic on a subdomain.
Example 2: You could have a view for tracking all traffic from a particular country.
You no longer have views in GA4. Now we have Data Streams which are different sources of information that each feed into your Google Analytics property. So, you could have a data stream for your website, an iOS app or an Android app and see aggregated reports.
At this stage, you can’t set up filtered views for each data stream in GA4 as you could in GA3, but that’s not to say that Google Analytics won’t give us this capability in the future.
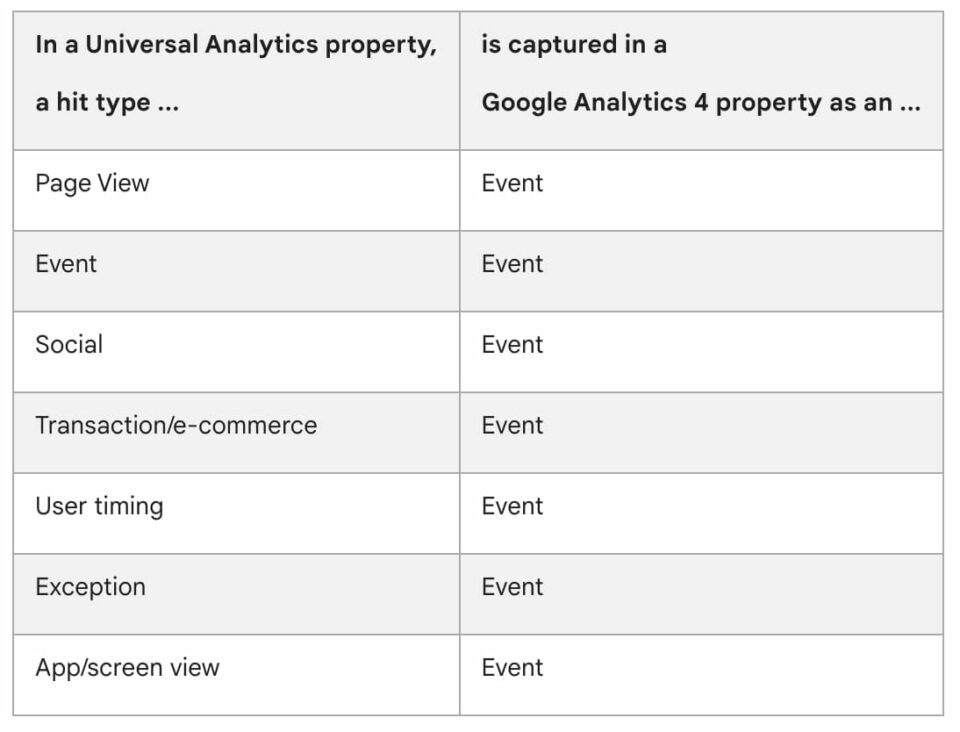
All Hit Types (GA3) are now Events (GA4)
A “hit” is an interaction a user makes on your website that results in data being sent to Google Analytics. So, basically, a hit is when something happens. Some examples are when a user visits a page, clicks a link, plays a video, downloads a file, purchases a product etc.; these are all hits.
GA3 separated out the different types of hits under a relevant “hit type” category.
In GA4, though, every hit is now called an Event.
This is one of the key differences between GA3 and GA4.
With GA3, not many hits were automatically tracked. If you wanted to track something like a link click or a purchase, you’d need to use a third-party application.
In GA4, many of the useful simple hits are automatically tracked.
Google has categorised the types of events that can be tracked in GA4 under the following categories:
- Automatically collected events – As the name suggests, these events are automatically tracked without you having to do anything.
Examples: session start, page view, first visit, click. - Enhanced event measurement – These events are collected when enhanced measurement is enabled within GA4. So, they are still automatically collected, but you just need to enable the setting.
Examples: click (with extra parameters like the link’s URL), page view (with extra parameters like the page referrer), video engagements, form submissions, file downloads. - Recommended events – These events you will need to set up yourself with a third-party application to start collecting, but Google has set up some predefined names and parameters. Google says, “You should send recommended events with their prescribed parameters to get the most details in your reports and to benefit from future features and integrations as they become available.”
Examples: login, purchase, remove_from_cart, view-item. - Custom events – These events are ones that you define and set up with a third-party application to start collecting and have no predefined names or parameters. Google says, “Custom events don’t show up in most standard reports, so you need to set up custom reports or explorations for meaningful analysis.”
Examples: Anything else you’d like to track that doesn’t fall into the above categories.
Goals (GA3) are now Conversions (GA4)
In GA3, you would set up “Goals”, which essentially tracked and counted the desired actions you wanted your visitors to take.
There were four types of goals that you could set up:
- Destination – (like a thank you page with a dedicated URL)
- Duration – (length of visit)
- Pages/Screens per session – (how many pages a user visits)
- Event – (any custom event that has happened, button click, form submission etc.)
GA3 only counts one conversion per session for each goal. So, if a visitor submitted a form twice during one session, it would only count as one goal conversion.
In GA4, goals are no more. Now we call them conversions, and we can choose which events to track as a conversion (which essentially is very similar to GA3’s goals).
GA4 counts each instance of a conversion in a session. So, if a visitor submitted a form twice during one session, it would count both instances as conversions.
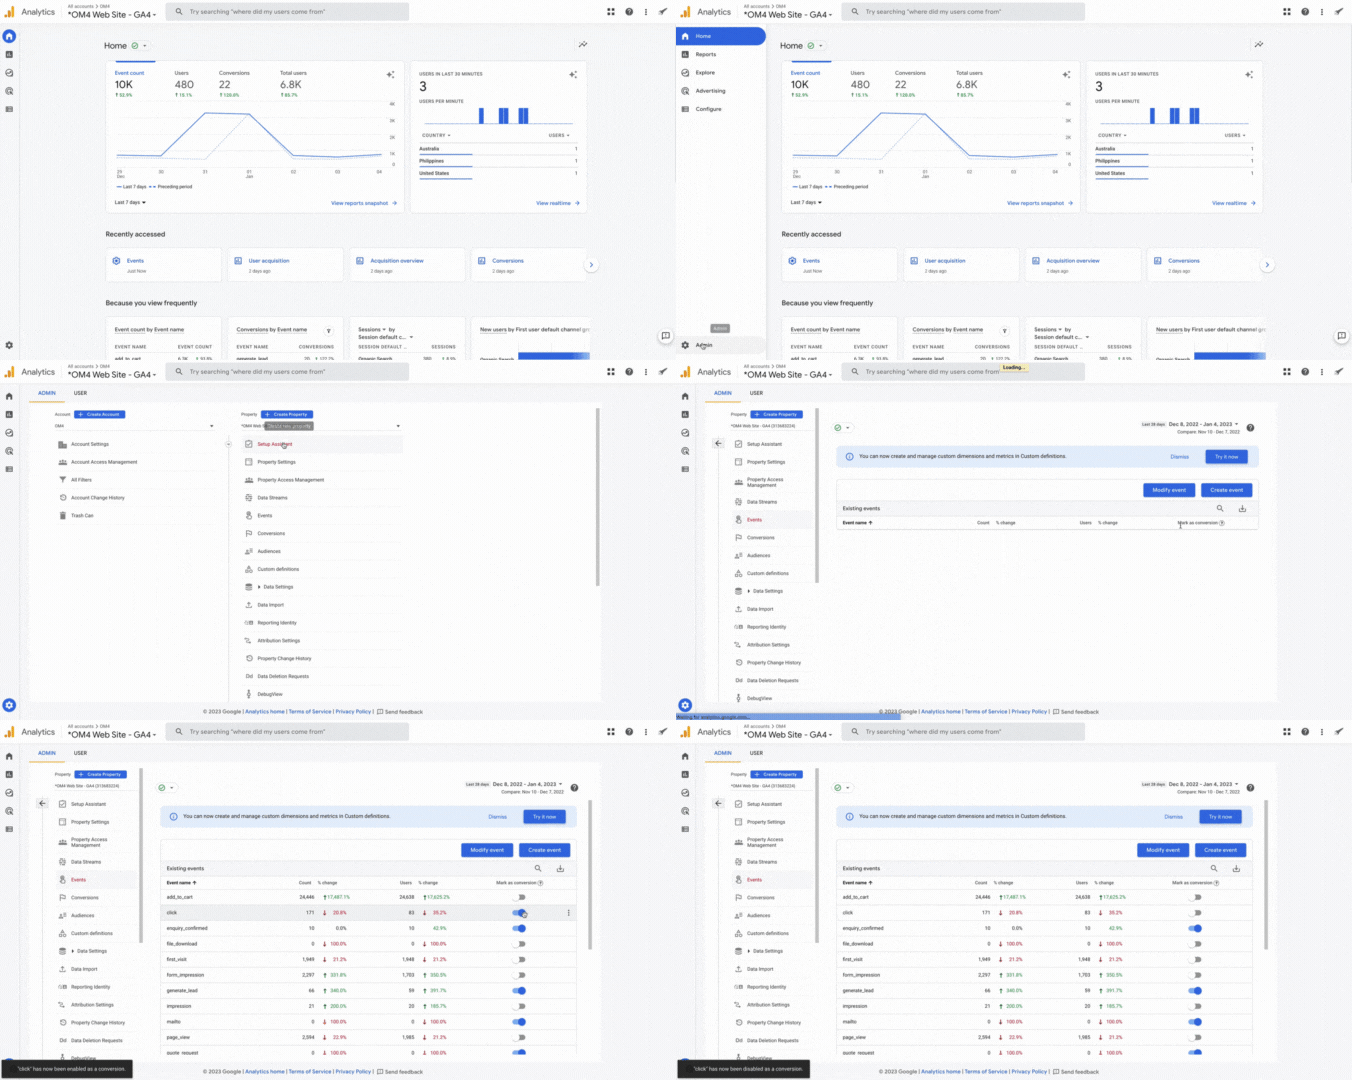
How to mark an Event as a Conversion
Head to Admin / Events (in the Property column), this will take you to a master list of all your events, which will include the out-of-the-box events that GA4 is automatically tracking for you.
From there, you can create new custom events (for example, you could create an event for when someone visits a particular URL, such as a thank you page), and you can toggle to mark specific events as a conversion.
Pageviews (GA3) are now Views (GA4)
Pageview metrics between GA3 and GA4 should be very comparable. Keep in mind now, though, that in GA4, we also have “Views”, which is a combination of pageviews (web) and screenviews (app).
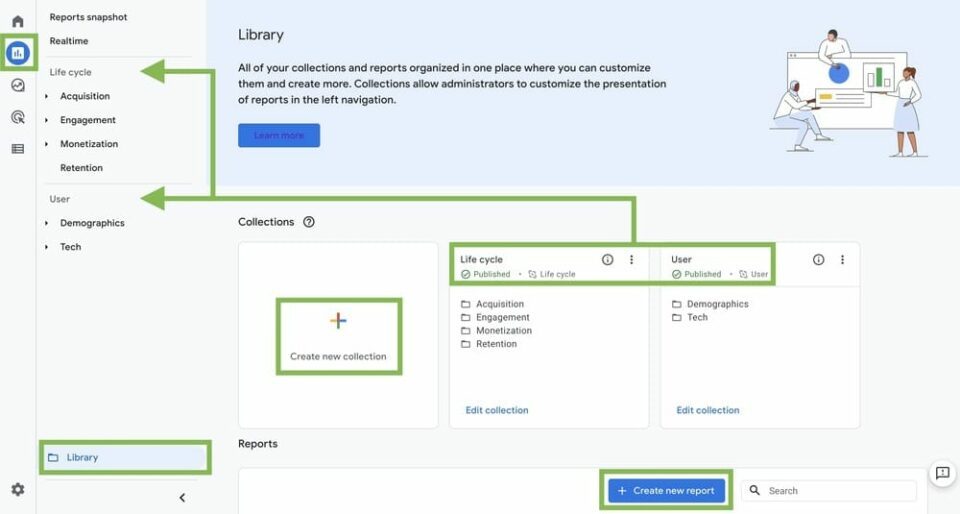
The Customization menu (GA3) is now the Library (GA4)
In GA3, you can create custom reports, which are accessible via the customisation menu.
GA4 has increased the functionality of this feature with the introduction of the Library. The library is where you can find all of your current reports and even create new custom ones. You can also edit or add “Collections”. Collections are a group of related reports which appear on the left-hand side reports menu. Life Cycle and User collections are activated by default, but you can add your own if you like.
Here’s how some metrics have changed
Not all metrics you’re used to seeing in GA3 will be calculated exactly the same in GA4 or be available in the default reports.
In general, though, if a metric you’re used to seeing is missing, it’s probably still available should you wish to add it back in, but it has likely been replaced in the standard reports by more effective and meaningful metrics.
GA4 is pushing more focus on the users and engagement with the upgraded platform.
Bounce Rate
The way the bounce rate is calculated has changed, so don’t compare your GA3 bounce rate to the new bounce rate in GA4, as it will be vastly different.
In GA3, a bounce is considered to be when a visitor only views a single page and does not click to view any other pages on your website, despite how long they are there. So, if someone landed on a page on your website and left after 10 seconds, this was counted as a bounce. So too, would be someone who visited a single page and then stayed there for 10 minutes reading before they left.
The bounce rate is then calculated by dividing the number of bounces that occurred by the number of sessions, giving you a percentage.
In GA4, what is considered to be a bounce is completely different. GA4 looks for indicators that a visitor’s session is an engaged session, and if it isn’t, then it’s counted as a bounce. This makes the bounce rate the exact inverse of the engagement rate, i.e. if the engagement rate is 40%, the bounce rate would be 60%.
To get an idea about what is considered a bounce in GA4, let’s look at what Google defines as an engaged session.
“An engaged session is a session that lasts longer than 10 seconds, has a conversion event, or has at least 2 pageviews or screenviews.”
So conversely, if a user visits your website and does not stay longer than 10 seconds, does not trigger a conversion event or does not visit at least 2 pages, then they are a bounce.
The change to this metric makes sense, websites and apps are getting much better at including a lot of functionality on a single page. GA3 would be counting a session as a bounce even though there could have been a lot of engagement on the page. GA4 fixes this.
You’ll find the engagement rate metric on the “Traffic acquisition” report under “Acquisition”.

Until recently, the bounce rate metric wasn’t available in GA4. So, Google is continually adding functionality as time goes by.
The bounce rate does not appear on the standard reports, but you can add it in if you like by customising the report, though perhaps a more effective metric to focus on moving forward would be the engagement rate.
Pages per Session
In GA3, you would be able to see the metric for pages per session, which is the average number of pages that a visitor would visit in a session.
This metric is no longer available in the default reports and has been replaced with “views per user” in GA4. Views per user is the average number of combined pageviews and screenviews a user has. As you can tell, the focus is more on the user here rather than the session.
You’ll find the views per user metric on the “Pages and screens” report under “Engagement”.
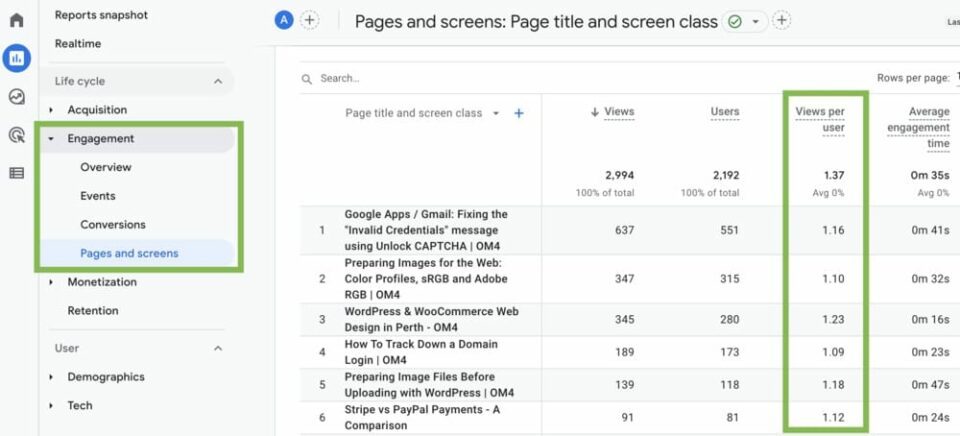
The pages per session metric is still available in GA4, you will just need to add it in (see how to customise a report). It’s now called “Views per session”.
Average Session Duration
In GA3, you would be able to see the metric for average session duration, which is the average time that someone would have your website or app open in the foreground or the background. That means if they had your website open on a tab that they weren’t actively using, the duration clock would keep on ticking.
This is not overly helpful information.
GA4 is all about engagement, so you won’t find the average session duration on your default reports as it has been replaced with average engagement time.
You’ll find the average engagement time metric on the “Pages and screens” report under “Engagement”.
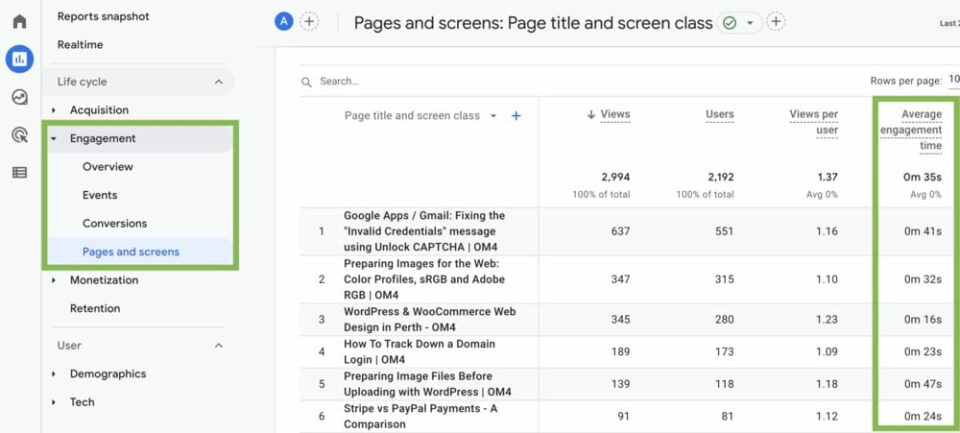
The average session duration metric is still available, so feel free to add it back in if you like by customising the report; however, the average engagement time would be a more effective metric to focus on moving forward.
There is a new approach to Users
A user is a visitor who has initiated a session on your website.
GA3 uses the device ID as the primary identifier to differentiate one user from another. GA4, however, uses multiple sources of ID to differentiate its users. This theoretically means that GA4 is much better at deduplicating users giving more accurate user counts.
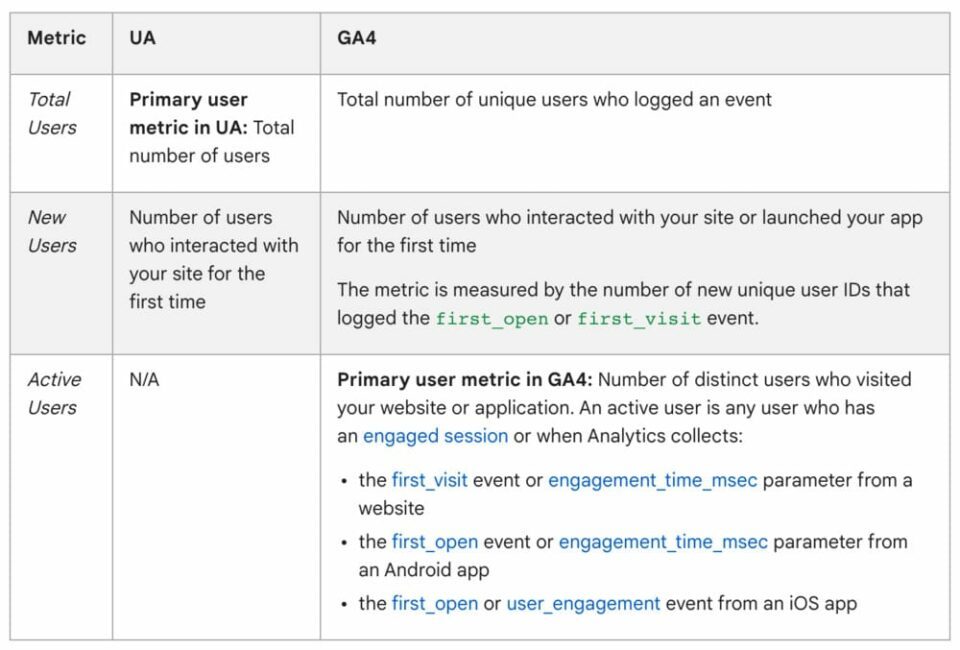
In GA3, there are two metrics related to users: Total Users and New Users. The total users metric is the primary user metric used in reports in GA3.
In GA4, there are three metrics related to users: Total Users, Active Users and New Users. The active users metric is the primary user metric used in reports in GA4.
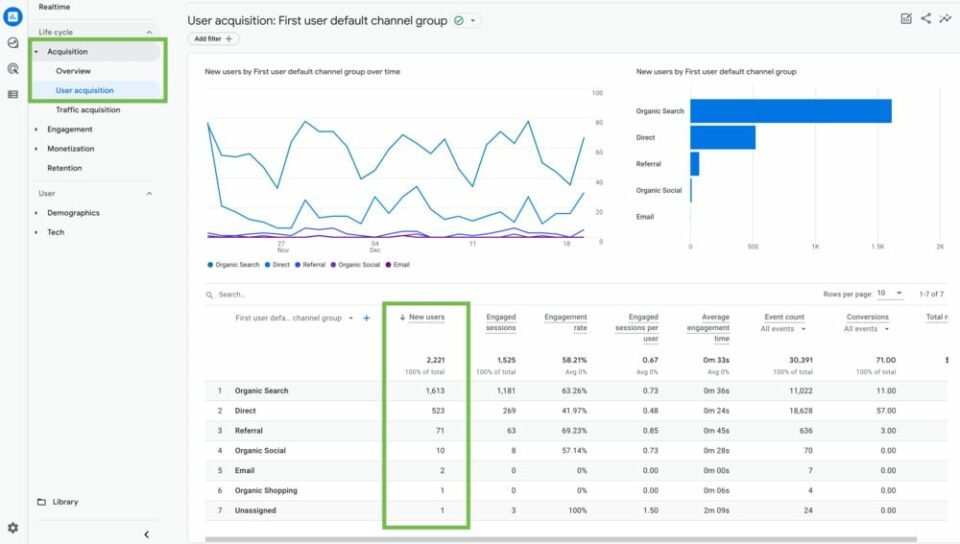
Where to find the New Users metric in GA4
You’ll find the new users metric on the “User acquisition” report under “Acquisition”.
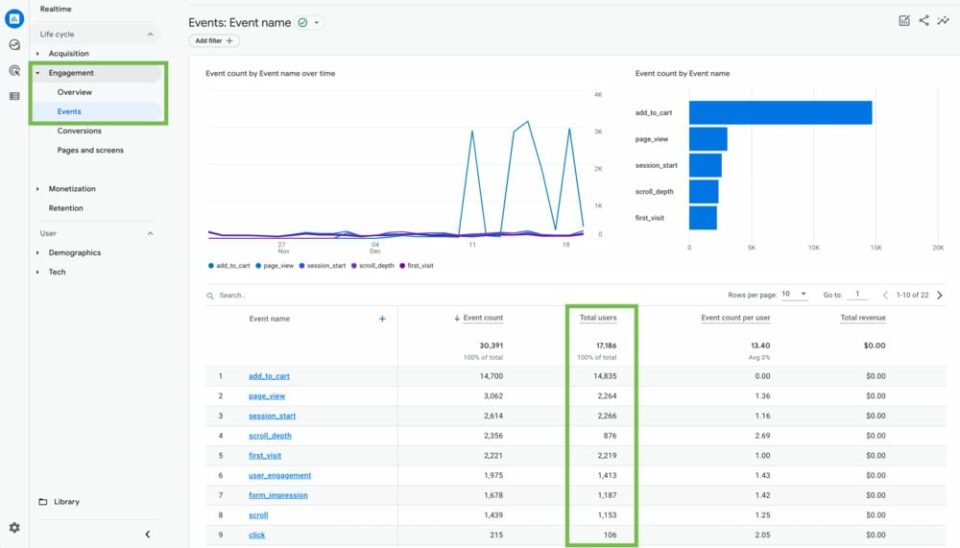
Where to find the Total Users metric in GA4
You’ll find the total users metric on the “Events” report under “Engagement”.
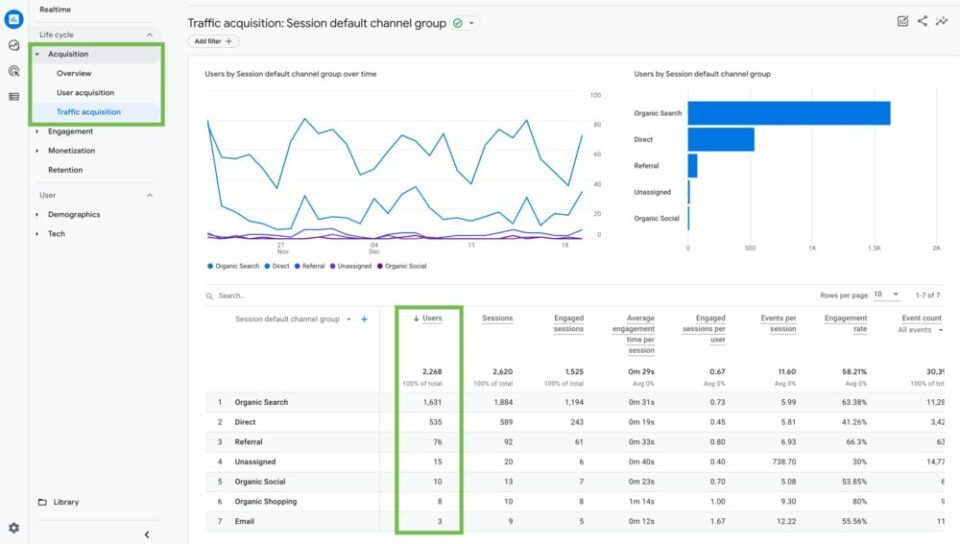
Where to find the Active Users metric in GA4
You’ll find the active users metric on the “Traffic acquisition” report under “Acquisition”.
Where to find the Returning Users metric in GA4
You’ll find the returning users metric on the “Retention” report under the “Life cycle” collection.

The reporting is simpler
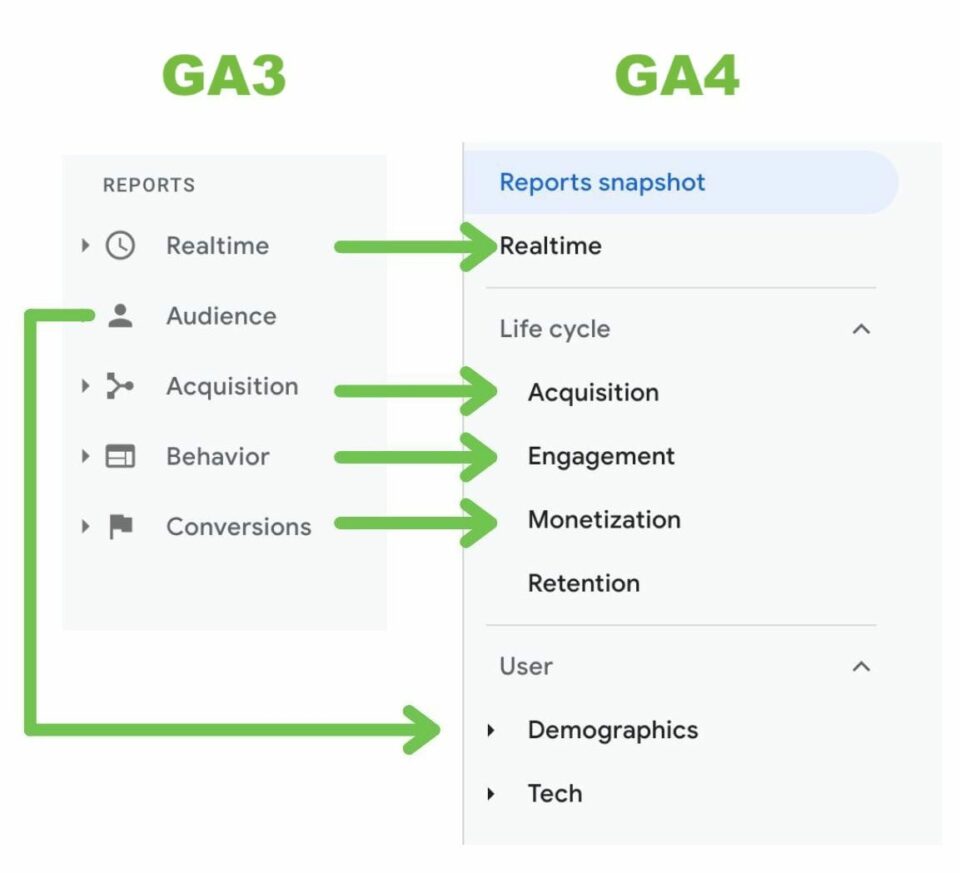
GA3 has a lot of reports. GA4 has simplified the reports, but still gives you the ability to customise existing reports or even create your own so that you can see the data that’s most important to you.
- The Audience reports are under the User collection in GA4
- The Acquisition reports are in the Life cycle collection in GA4, in the Acquisition menu
- The Behaviour reports are in the Life cycle collection in GA4, in the Engagement menu
- The Conversions (eCommerce) reports are in the Life cycle collection in GA4, in the Monetization menu
- The Conversions (Goals) reports are in the Life cycle collection in GA4, in the Engagement > Conversions menu
Where is the GA4 Landing Pages Report?
A landing page is a page on your website that someone first lands on when they click a link to your website. For example, if someone searches for a keyword in Google and clicks on your website link, then the page they are taken to first would be your landing page. This could be any page on your website relevant to what they were searching for.
In GA3, you could access a report to show you your top landing pages. This report is not provided in GA4 currently, however, the report is still accessible, so you can add it in if it’s useful for you.
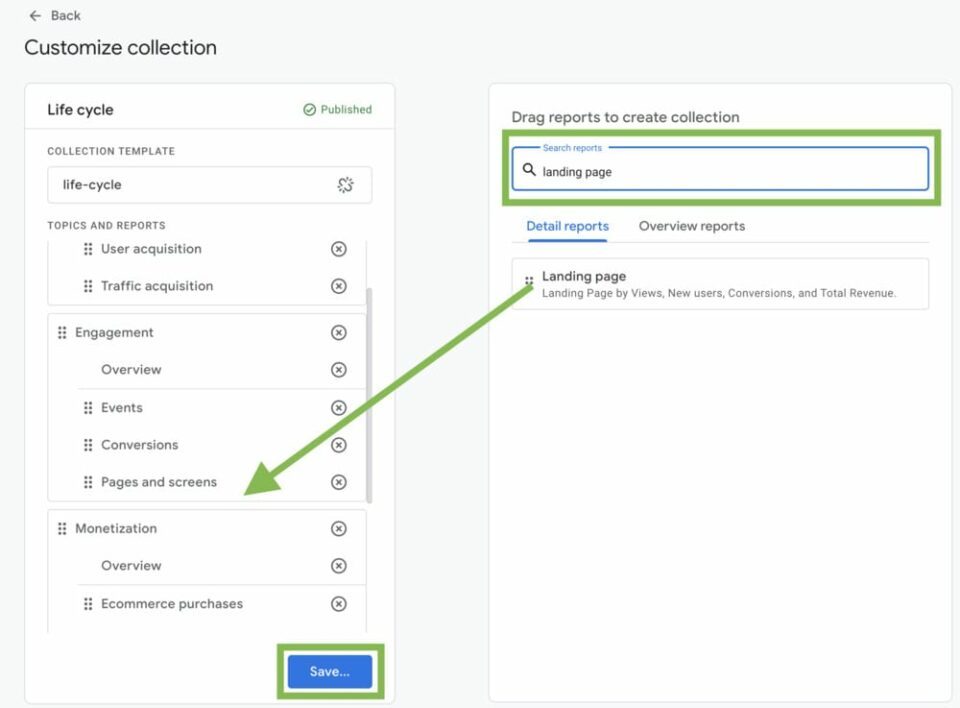
To add the landing page report to your sidebar, head to the Library and click “edit collection” inside the Life cycle collection.
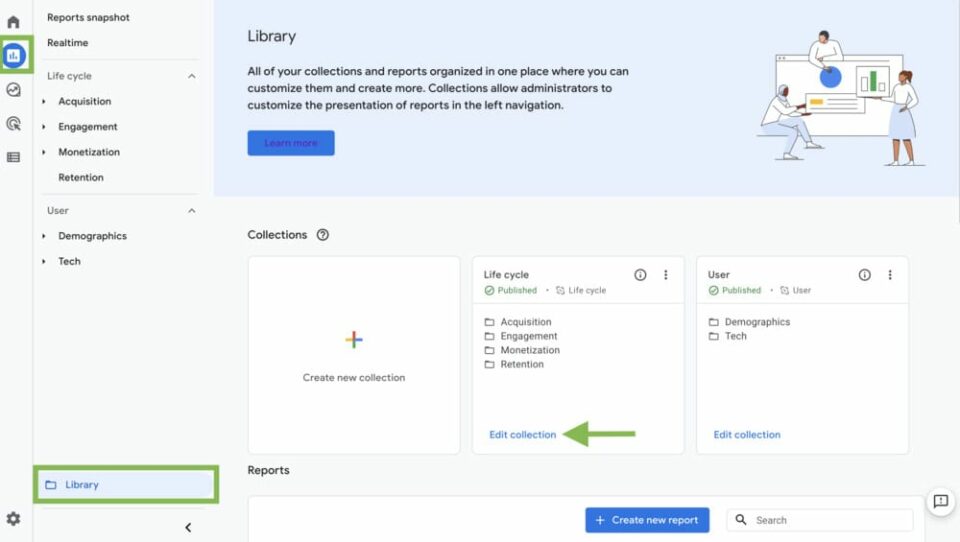
Then type “landing page” into the search bar and drag and drop the landing page report into the collection.
It’s easier to customise reports
One great feature of GA4 is the increased flexibility to customise existing reports and create your own reports.
Looking at any report on the GA4 dashboard, you’ll see in the top right corner of the page a little pencil icon. If you click on that, you’ll be able to delete metrics and dimensions that you have no interest in seeing, and you can add in ones that would be helpful to see in the report.

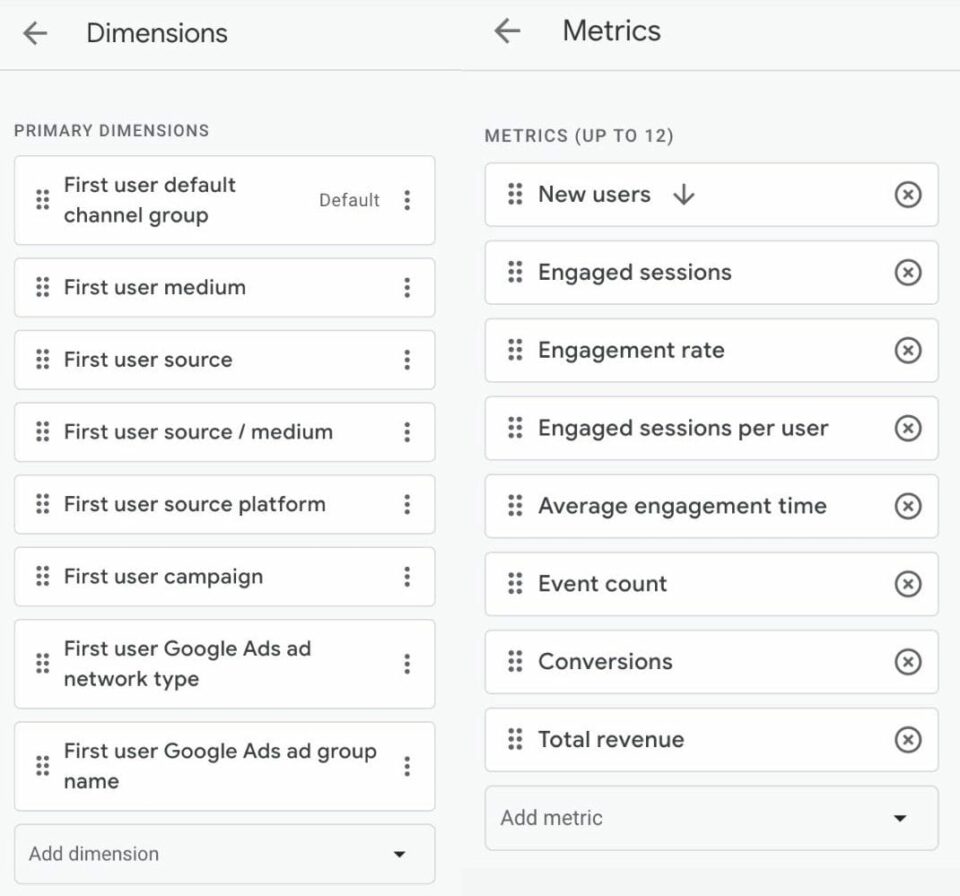
Once you’re done customising your report, you can choose to save over the current report or save to a new report. If you choose to save to a new one, the newly created report can be found in the Library.
You can uncover deeper insights with Explorations
GA4 has introduced a new feature called “Explorations”. Google says, “Explorations is a collection of advanced techniques that go beyond standard reports to help you uncover deeper insights about your customers’ behavior.”
You can create ad-hoc exploration reports to explore your data in depth. To start with an exploration, click on the Explore menu and click to create a blank one or choose a template to get started.

Conclusion
Making the switch from Universal Analytics (GA3) to Google Analytics 4 (GA4) may be seen as an inconvenience by some, particularly those well-versed in using the former.
However, it is important to note that GA4 offers several new features and improvements. These include a more robust and flexible data collection system, improved tracking of users across devices and platforms, a more intuitive user interface, and increased integration with other Google products. These enhancements may make GA4 a more accurate, user-friendly, and streamlined tool than GA3.
By implementing GA4 now, users have the opportunity to become familiar with the new data and where to find important information before the July cutoff date, when GA3 will no longer collect new data.
